

select search filters
briefings
roundups & rapid reactions
Fiona fox's blog
The Office for National Statistics (ONS) have released the headline results from their COVID-19 Infection Survey.
Prof Sheila Bird, formerly Programme Leader, MRC Biostatistics Unit, said:
“In 2021, the vaccine-era, tables on COVID-mention deaths by week of occurrence should perhaps heed ONS Infection Survey’s prevalence estimates some 2 weeks earlier.
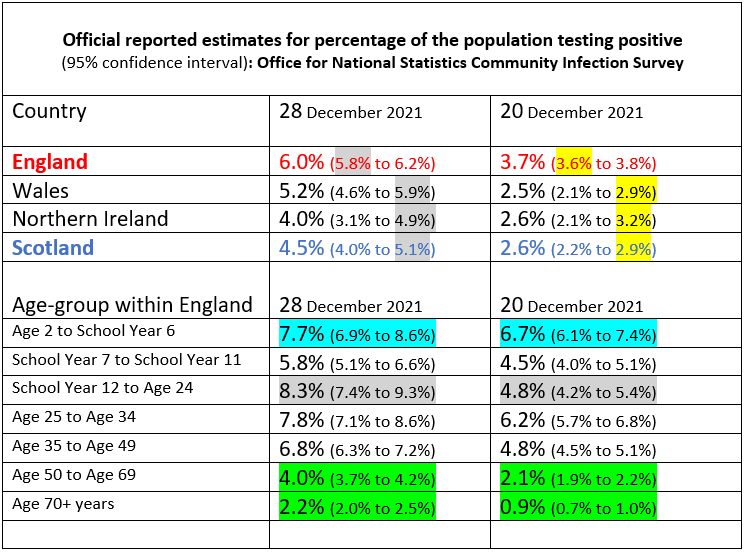
“Hence, England’s Alpha peak (during 27 Dec 2020 to 2 January 2021) reported 2.08% (95% CI: 2.0% to 2.2%) of the population as having tested positive for COVID-19 in ONS-CIS; in the Delta-era, 0.61% (95% CI: 0.5% to 0.7%) of the population had COVID during 27 June to 3 July 2021 vs 1.44% (1.3% to 1.5%) during 26 September to 2 October 2021 with the Delta peak (during 16 to 30 October 2021) also 2.02% (95% CI: 1.9% to 2.1%).
“Today’s release by ONS-CIS allows comparison between 20th and 28th December 2021 for each nation of UK; and by age-group for England. Despite low response-rates in ONS-CIS, temporal comparisons, as below, are essentially like-with-like within country; and per age-group in England.
“First, substantial increase in prevalence has occurred in each country from 20 to 28 December 2021: ranging from 50% increase to doubling. Second, prevalence was and is highest in England: at 6.0%, England’s latest prevalence is 3 times England’s previous alpha & delta peaks (2.1% & 2.0%). Notice: other nations’ upper 95% confidence limits barely overlap England’s lower 95% confidence limit. Confidence intervals are narrower for England because ONS survey size is substantially larger – about 9 times greater than for Scotland. Hence, width of 0.4% for England vs 1.1% for Scotland on 28 December 2021; width of 0.2% for England vs 0.7% for Scotland on 20 December 2021.
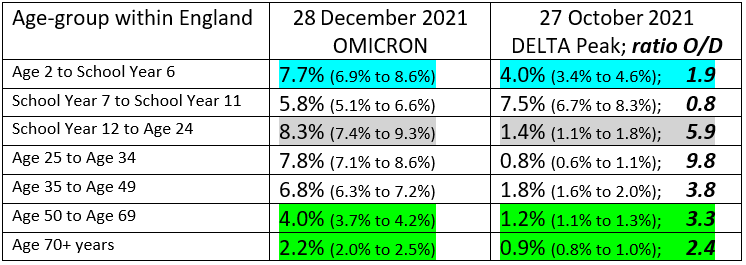 “Even at 28 December 2021, the age-distribution of prevalent infections is, as yet, substantially younger than in previous waves thanks to immunization and possibly other factors, see above ratios for England of Omicron versus Delta peak prevalence (O/D) by age-group.
“Prevalence has not shifted much between 20 and 28 December 2021 in England’s youngest age-group but doubled in the oldest two age-groups: Age 50 to 69 years (from 2.1% to 4.0%) and aged 70+ years (from 0.9% to 2.2%). The age-group with the next highest observed rate of increase (1.7-fold) is School Year 12 to Age 24: up from prevalence of 4.8% on 20 December 2021 to 8.3% by 28 December 2021.”
Prof Kevin McConway, Emeritus Professor of Applied Statistics, The Open University, said:
“ONS have published their headline results on their Coronavirus Infection Survey (CIS) two days early, because they want to get the main results out as soon as possible in these days of a very rapidly changing pandemic, with very high numbers of infections. Today’s results give estimates for 28 December, with some estimates for London going up to the 31st. There will doubtless be more detail in the usual CIS weekly publication, due back after its Christmas break on Friday.
“The picture on the whole is pretty grim, though there are a few potentially encouraging points. ONS now estimate that the proportion of people who would have tested positive on 28 December was about 1 in 15 in England, 1 in 20 in Wales, 1 in 25 in Northern Ireland and 1 in 20 in Scotland. These are major increases on the previous headline results, for 20 December so just over a week earlier, where the corresponding figures were 1 in 25 for England and 1 in 40 for each of the other three countries (with, of course, some statistical uncertainty). The total estimated number of people in the UK who would test positive, as of 28 December, is just over 3.7 million. The 20 December estimate was about 2.3 million, so the number has gone up by almost two thirds (64%) in eight days.
“Just for clarity, this does not mean that the number of people who became infected between 20 and 28 December was 3.7 million minus 2.3 million, or 1.4 million. Some of the people who were infected on 20 December would have cleared the infection by 28 December and would no longer test positive. So the number of newly infected people between 20 and 28 December must have been considerably in excess of 1.4 million.
“The increase in testing positive between 20 and 28 December isn’t uniform across the whole UK. The estimated numbers more than doubled in Wales (106% increase) and went up by about three quarters in Scotland (76% increase). The increases in England (62%) and in Northern Ireland (53%) were smaller, but still very substantial.
“Omicron now dominates in all four UK countries and every English region.
“Detailed results for subgroups of the population are given by ONS only for England. By age group, the smallest increase was in children aged from 2 years to school year 6 (primary school age and below), up by only 15% between 20 and 28 December, so (given the statistical uncertainty) not really clear evidence of an increase at all. But still in that youngest age group slightly more than 1 in 15 would test positive, it’s estimated. Across England, infection rates went up by getting on for a third (29%) in children of secondary school age (school years 7 to 11). The position by 28 December, according to ONS, is that the differences between infection rates between different age groups under 50 were rather small – ONS estimate about 1 in 15 infected for most of them, though 1 in 10 for those between school year 12 (about 17) and age 24.
“Perhaps most worrying is that the rises in infection in the two oldest age groups, 50-69 and 70+, are much larger. The rate almost doubled in the 50-59 year olds, so that by 28 December ONS estimate that 1 in 25 would test positive. In those aged 70 and over, the estimated increase was a huge 159%, going up from 1 in 120 on the 20th to 1 in 45 on the 28th. Even though the rates of testing positive are still lower in these older age groups than in younger people, the increases are potentially very worrying because severe illness and death from Covid have always been more likely in older people. Perhaps there won’t be a correspondingly large increase in hospitalisations and deaths, given the high proportions in these older groups who have received a booster, and the evidence we’ve had so far on the effectiveness of booster jabs against Omicron. But there is bound to be some further increase in hospitalisations and deaths.
“Rates of testing positive vary less between different regions than was the case a few weeks ago. ONS estimate that about 1 in 10 people in London would have tested positive on 28 December, about 1 in 30 in South West England, and 1 in 15 or 1 in 20 in each of the seven other English regions. What’s interesting is that the estimated increases in the numbers of infections between 20 and 28 December differ a lot from one region to another. The increase was fastest in the North of England, with estimated positivity considerably more than doubling in those 8 days in the three regions there. In the two Midlands regions, rates roughly doubled. But increases were smaller in the four regions in the South, particularly in London, where the increase was only 16%. London, however, remained with the highest infection rate of all the regions on 28 December, with about 1 in 10 estimated to test positive.
“The slowdown in infections in London is encouraging, given that infections increased fastest in London after Omicron appeared. But, on these ONS estimates, infections were still increasing in London, just a lot more slowly than in the recent past. I hope that slowdown happens elsewhere, and I also hope (but can’t be at all certain yet) that the increases in London are now stopping. But we do have to remember that London is quite a lot different from all the other English regions (and indeed the other UK countries that England) in several ways – patterns of mixing, the age of the population (with fewer older people than other regions), and lower vaccination rates. We can’t just say that what is happening in London will happen in the same way elsewhere.
“Probably the most encouraging aspect of today’s data release is the most detailed – results from the CIS statistical model for individual years of age and individual dates, for London. The snag is that these estimates are subject to quite high levels of statistical variability. That’s simply because the number of people in a single year of age in London is not large, so that the numbers in a single year of age swabbed for the survey is relatively small. These particular figures go up to 31 December, and give an indication that increases in infection rates are quite possibly levelling off or maybe even starting to decrease, particularly in children and those in younger age groups. ONS are, rightly, cautious about interpreting these figures and say simply that the trends in London in those of secondary school ages and age 25-49 are ‘uncertain’, and any very short-term trends many not continue. And this doesn’t really extend to the oldest age groups, where there’s very little clear sign of a levelling off. But it’s at least a positive point.
“Finally, I’ll point out that the results from the CIS are particularly important at this time of year. They are a bit less prompt than the daily figures on the Government dashboard – but particularly at Christmas and New Year the flow of data into the dashboard is disrupted by holidays of the people involved in collecting and collating the data. The dashboard figures can also be biased by changes in the numbers of people being routinely tested, the types of people testing and their reasons for testing, and indeed the availability (or lack of availability) of tests. The CIS isn’t affected by any of that, as it tests a representative sample of people from the community population, regardless of whether they might have symptoms. There’s been a lot of overinterpretation of changes in the dashboard numbers of confirmed cases – particularly at this time of year it’s very difficult indeed to say precisely what they might mean. The CIS might take a few days longer to get the results out, but the resulting numbers mean more.”
All our previous output on this subject can be seen at this weblink:
www.sciencemediacentre.org/tag/covid-19
Declared interests
Prof Kevin McConway: “I am a Trustee of the SMC and a member of its Advisory Committee. I am also a member of the Public Data Advisory Group, which provides expert advice to the Cabinet Office on aspects of public understanding of data during the pandemic. My quote above is in my capacity as an independent professional statistician.”
None others received