

select search filters
briefings
roundups & rapid reactions
Fiona fox's blog
The Office for National Statistics (ONS) have released the latest data from their COVID-19 Infection Survey.
Prof Sheila Bird, Formerly Programme Leader, MRC Biostatistics Unit, University of Cambridge, said:
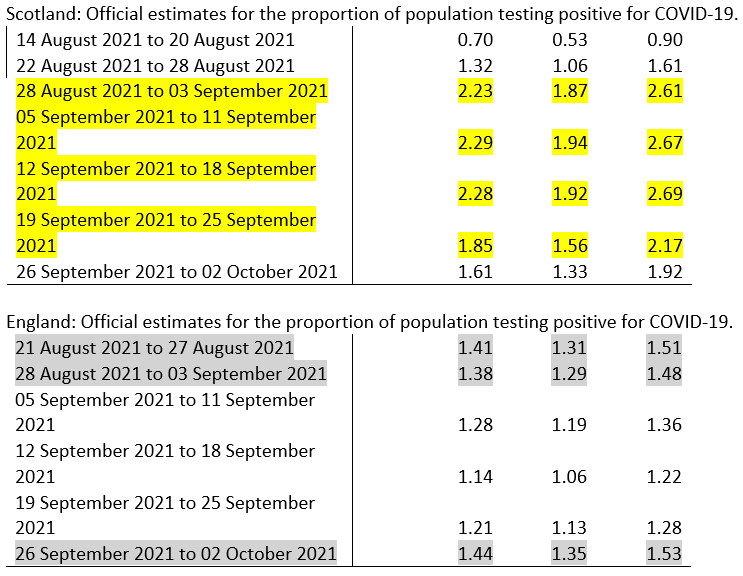
“Return to school in Scotland coincided with 3-fold increase from 0.7% to more than 2.1% in the proportion of Scotland’s population testing positive for COVID-19. Even before children in Scotland began their “tattie holidays” this weekend (9th October 2021), prevalence had begun to decrease. Prevalence is generally lower in England after schools re-opened in early September without apparent increase in the proportion testing positive for COVID-19 – effectively, the reverse!
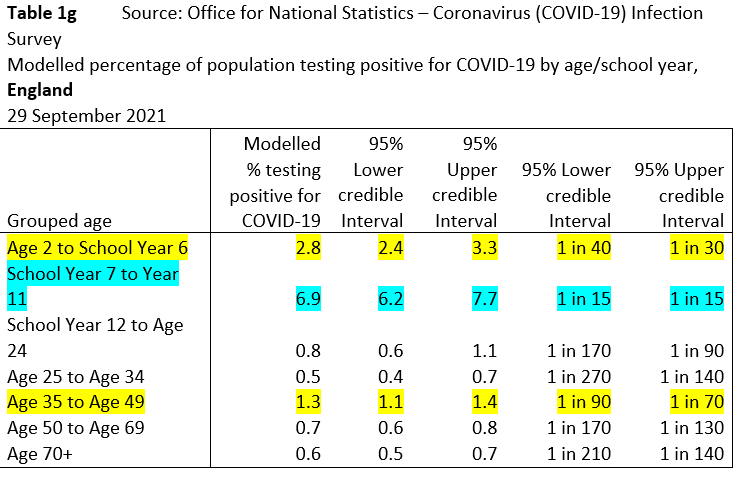
“ONS Infection Survey offers more detail by age but differently between England for grouped ages (shown first) and – less satisfactorily – for individual years of age in Scotland via modelling and despite lower numbers per year of age in Scotland than in England. In England, at 29 September 2021, a clear picture emerged: percentage of secondary pupils who tested positive for COVID-19 more than double at 6.9% (95% CI: 6.2% to 7.7%) than for younger children at 2.8% (95% CI: 2.4% to 3.3%). Thereafter, 35-49 year olds (who include parents with younger and teenage children) had the next highest prevalence at 1.3% (95% CI: 1.1% to 1.4%).
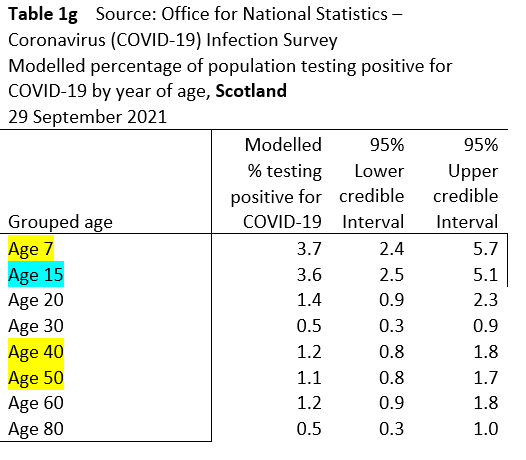
“For Scotland, specific ages within each of the above age-group are illustrated. Scotland’s modelled data do not suggest that prevalence was substantially higher for secondary pupils than for younger children (although the modelling may not have specifically tested that contention). However, the parenting ages of 40 and 50 years (but also 60 years) do support higher prevalence at these ages (which are also working ages).
“More thorough analysis than I can vouchsafe is needed to assess whether age-patterns are broadly similar or importantly different between England and Scotland. Back to ONS, please.”
Prof Kevin McConway, Emeritus Professor of Applied Statistics, The Open University, said:
“I find the latest results from the ONS Covid-19 Infection Survey concerning. The latest bulletin takes the data up to the week ending 2 October (so last week). Across the whole UK, the official ONS estimated number of people who would test positive for the virus that causes Covid-19 on any one day is over 940,000, about an eighth higher than the previous week. As in most recent weeks, the picture is different across the four UK countries.
“ONS estimate that infection levels fell in the most recent week in Scotland and in Northern Ireland, and with a quite considerable fall in Northern Ireland, from an estimated figure of about 1 in 65 people in the community population there testing positive in the week ending 25 September to an estimated 1 in 130 in the most recent week (ending 2 October), so that the rate approximately halved in a week. There’s a lot of statistical uncertainty about those figures in Northern Ireland, because the number of people swabbed for the survey there is relatively small, but it’s clear that there has been quite a considerable decrease. The change looks to be less in Scotland, with the positivity rate falling from about 1 in 55 to about 1 in 60, but ONS consider there is clear evidence of a decrease. That’s good news, and continues the pattern seen in Scotland for about three weeks now. In Wales, ONS consider that the trend was ‘uncertain’ in the most recent week. The central estimate of the proportion of people testing positive there is the same as the week before, at about 1 in 55, but again there’s quite a lot of uncertainty because the number of people swabbed for the survey in Wales is relatively small.
“However, in England, ONS estimate that the proportion of the community population testing positive was about 1 in 70 in the most recent week, so an increase in infections compared to the previous week when the rate was 1 in 85. That perhaps doesn’t look like such a large change, though in fact it is – the estimated numbers who would test positive across the country went up by about a fifth in a week, from about 660,000 people to about 790,000 people. Also, there’s much less statistical uncertainty about the England estimates than for the other three UK countries, because many more people are tested in the CIS in England than in the other countries. The last time the positivity rate was this high in England was in late January this year, when numbers of infections were high but had come down to some extent from their peak level of 1 in 50 at the turn of the year.
“It’s not difficult to see from these ONS results what’s driving the increase in England. The estimates for separate age groups are always subject to greater statistical uncertainty than the estimates for the whole English population, because obviously the number swabbed for the survey in a single age group is a lot smaller than for all age groups together. ONS estimate that there was a very considerable increase in the numbers who would test positive in children of secondary school age (school years 7 to 11, so age 11 or 12 up to age 16 or 17). The estimated rate in that age group for the most recent week is about 1 in 15. “That’s an increase from about 1 in 20 the previous week. Putting it another way, the estimated number testing positive rose by about half in a week – that is, for every 100 children in that age group who were infected the week before, about 150 would have been infected in the week ending 2 October. Putting it yet another way, there are in total about 4 million children in that age group in England. In the week ending 2 October, roughly 270,000 of them would have tested positive for the virus. The week before, the figure would have been about 180,000, so an increase of about 90,000 infections in a week in just this age group. However you look at it, this is a huge increase, and it clearly follows from schools having reopened and, crucially, from vaccination rates of children in that age group still being low.
“Of course, the effect of having an infection rate as high as this in England – or indeed in Scotland or Wales where the infection rate for the whole population isn’t much different – isn’t anywhere near as serious as it was when the rate was last this high, because of vaccinations reducing the risk of severe illness or death, if someone becomes infected. However, that doesn’t mean that we shouldn’t be concerned about it.
“There’s always some concern that infected children can pass on the virus to older people, perhaps in their own family. But let’s just consider the infected children themselves. It’s certainly true that they have a much lower chance of having severe Covid-19 than older people do – but that’s not the only possible consequence. Last week, about 270,000 children of secondary school age in England would have tested positive. A recent ONS release± on ‘long Covid’ estimated the chance of suffering from Covid-like symptoms in people confirmed to have an infection. The ONS statisticians made their estimates in several different ways, but, roughly speaking, they estimated that around one in twenty of children aged 12-16, who tested positive for the virus, would go on to have symptoms consistent with long Covid, 4 weeks after their initial infection or as much as 12 weeks after it. Roughly half of those would have symptoms severe enough to limit their day-to-day activities. Those figures come from analyses of the same data source as today’s bulletin (the CIS). Assuming those estimates apply to the 270,000 children of secondary school age who, ONS estimate, would have tested positive last week, that means that about 13,500 of them will go on to have long Covid symptoms, and almost 7,000 will have such symptoms that limit their day-to-day activity. That’s rather a lot of children who will have their schooling and other activities disrupted.
“I think the main necessary action here it to get on with vaccinating those aged 12-15 as quickly as possible – though, given that it takes time for the vaccine to become effective, that’s still not going to bring down the infection rate in this group all that fast. I’m certainly not suggesting general school closures, or anything like that – but I don’t think it’s an option to do nothing.
“ONS provide information about different ages in the other three UK countries in a rather different form, and there’s a great deal of uncertainty about the estimates for different ages there because the number of people tested is quite small. But overall the position on infections in children of secondary school age does look as if it could be reasonably similar in Wales and Scotland to the position in England. Things look better for that age group in Northern Ireland.
“ONS also reported increases in the positivity rate in other age groups in England, namely in those aged 35-49 and those aged over 70. They estimate that rates continued to fall in those aged from school year 12 to age 24, and in all the other age groups that they use, trends are uncertain. But the rise in positivity rates in some age groups doesn’t mean that the resulting rates are anywhere near as high as they are in children of secondary school age. For those aged 35-49, the latest estimate is that 1 in 80 would test positive, and for the over 70s, 1 in 170. The estimated rates in all age groups from school year 12 upwards, apart from the 35-49 group, are also lower than 1 in 100, generally quite a lot lower. The rate of positivity in children of primary school age and younger (age 2 years to school year 6) is still relatively high, at about 1 in 35, but it has risen much more slowly that for secondary school children since the schools reopened, and the rise in those younger children may well be stopping. So there is good news in most other age groups, but, to repeat myself, the position in secondary school pupils is concerning.
“As always, ONS also provide estimates of the positivity rate in the different English regions. For the latest week, ONS estimate that numbers testing positive increased in eight of the nine English regions. The exception was the East if England, where the trend was said to be ‘uncertain’. For the most recent week, rates were highest in the Northern and Midland regions, where estimated rates ranged from 1 in 55 to 1 in 65. The estimated rate in the South West was also 1 in 65. Estimated rates were lower in London, the South East and the East of England, ranging from 1 in 85 to 1 in 90.”
All our previous output on this subject can be seen at this weblink:
www.sciencemediacentre.org/tag/covid-19
Declared interests
Prof Kevin McConway: “I am a Trustee of the SMC and a member of its Advisory Committee. I am also a member of the Public Data Advisory Group, which provides expert advice to the Cabinet Office on aspects of public understanding of data during the pandemic. My quote above is in my capacity as an independent professional statistician.”
None others received.